How to spot your best clients in your data
The trap most service businesses fall into when describing their "ideal client" is feel-words. Loyal. Easy. Aligned. Useless, because every existing client believes they fit them. Here is the definition you can pull from data.
Hi friend,
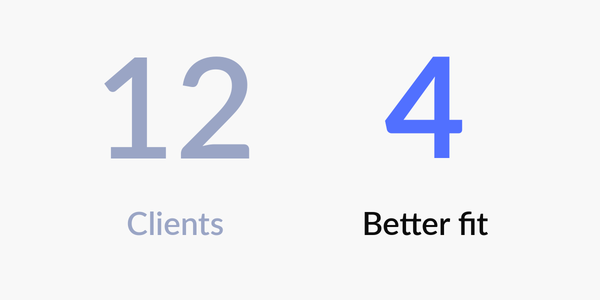
Last week I told you the growth move is not more clients. It is the same number of clients, better matched. Today I show you how to spot the better ones in the data you already have.
The trap most service businesses fall into when they try to identify their "ideal client" is to describe them in feel-words. "Loyal." "Easy to work with." "Aligned with our values." Those words are useless, because every existing client believes they fit them. You cannot filter your marketing on a vibe.
What you need is a definition you can pull from data.
1) The signal
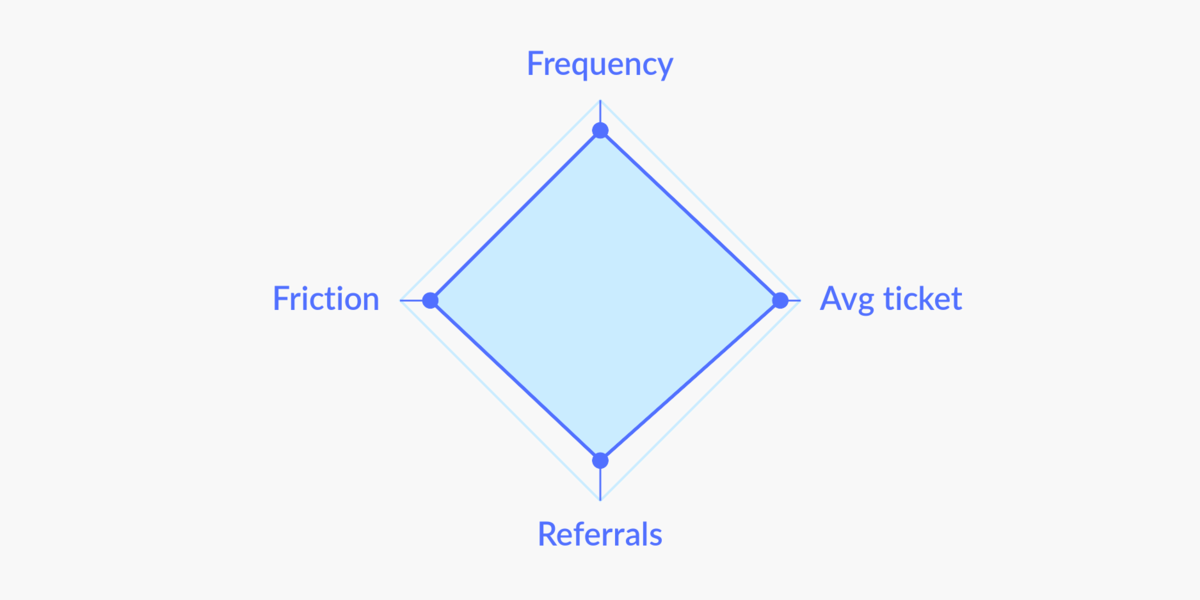
Your best clients show up the same way in four data points, weighted equally:
- Frequency. How often they buy from you, relative to your average client.
- Average ticket. How much they spend per transaction, relative to average.
- Referrals. How many other paying clients they brought in. This is the metric most owners under-track, and it is the strongest predictor of lifetime value.
- Friction. How many times they complained, rescheduled, or required scope renegotiation. This one is inverted, lower is better.
A client who scores in the top tier on three of four is in your top decile of value. Referrers specifically are roughly 4x more valuable over their lifetime than non-referrers, because their cost of acquisition rounds to zero and they screen for like-minded clients on your behalf.
2) The tool
The same booking software you opened in Issue 04 and Issue 05, with two more filters.
- Export client list with total spend and visit count.
- CRM or a Google Sheet: filter by "referred by" and count referrals per client.
- For the friction score: scan rescheduling history, support tickets, or your memory. Three or more notes against a name is a friction signal.
If you do not yet track referrals, start today. Tag every new client with the name of the person who sent them. Within six months you will know who your real growth engine is.
3) The action
Pull the data. Score each client 1 to 4 on each metric. 16 is the max. Anyone scoring 13 or higher is in your ideal client tier.
Then write a 3-sentence ideal client profile. Use the real attributes of your top tier, not aspirational ones. "Books every 5 to 6 weeks, average ticket $180+, brought in 2+ referrals in the past year, never rescheduled" beats "loves what we do and gets it."
Use that profile for three moves this month:
- Match it against your dormant clients from Issue 05. The matches are the rescues that matter most.
- Use the language in your next LinkedIn or Instagram post about who you work with. Specific beats clever.
- Decline one prospect this quarter who does not fit. The energy you free up goes to the ones who do.
The pricing decision (Issue 04) and the dormant-client rescue (Issue 05) both pay off harder once you know which clients you are aiming at.
Pulling four metrics like this requires your tools to actually talk to each other. If you want a quick read on whether yours do, the Business Checkup starts with three questions and a 0-to-100 score on your digital foundation. Or hit reply with the name of your highest scorer and I will tell you what to do next with them.
If this is useful, forward it to one operator who needs to stop chasing volume. The web version lives here.
Talk soon, Anne-Cécile
P.S. The referrer metric is the underrated one. Most owners only track who is spending money, not who is bringing in people who spend money. Start tracking it this week, even with a Google Sheet. By Q4 it will change how you market.